All statistics verified against primary sources: UBS Global Wealth Report 2025 (June 2025), US Bureau of Labor Statistics official CPI-U data, S&P Dow Jones Indices annual returns, FDIC national rate surveys, and published S&P historical CAGR data since 1926.
Most people think finance is about money. It isn't. Finance is the architecture of power — who controls capital, how it flows, and who gets to compound it over time. Understanding the system is the single most important financial literacy skill you can develop.
This visual guide breaks down the global financial system in 8 data-backed slides — from wealth distribution to compound interest to inflation — using verified data from UBS, BLS, S&P Dow Jones Indices, and FDIC.
Visual Guide — 8 Slides
Swipe or tap arrows to navigate. Each slide is backed by verified institutional data.
The Core Ideas — Explained
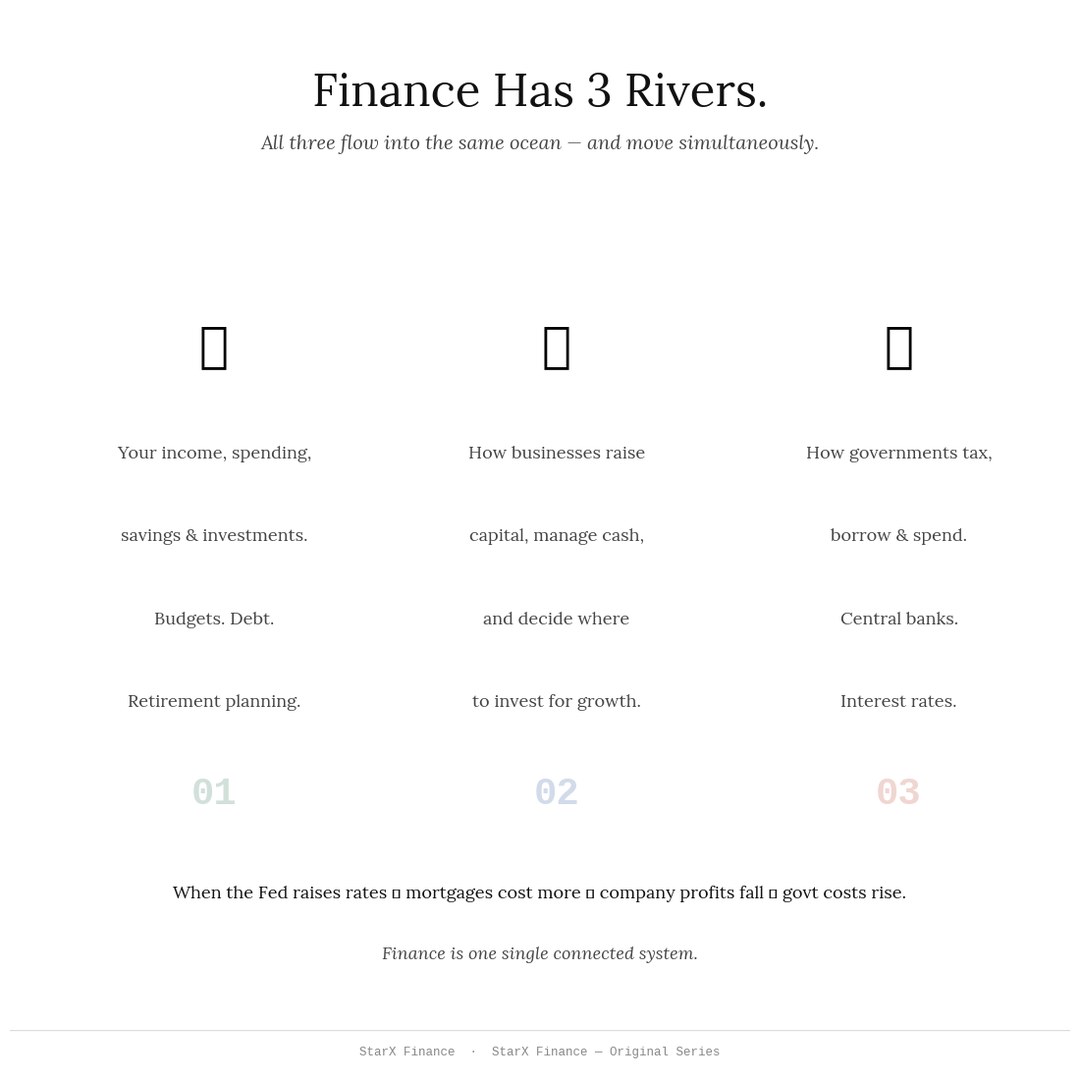
Finance Operates Across Three Domains
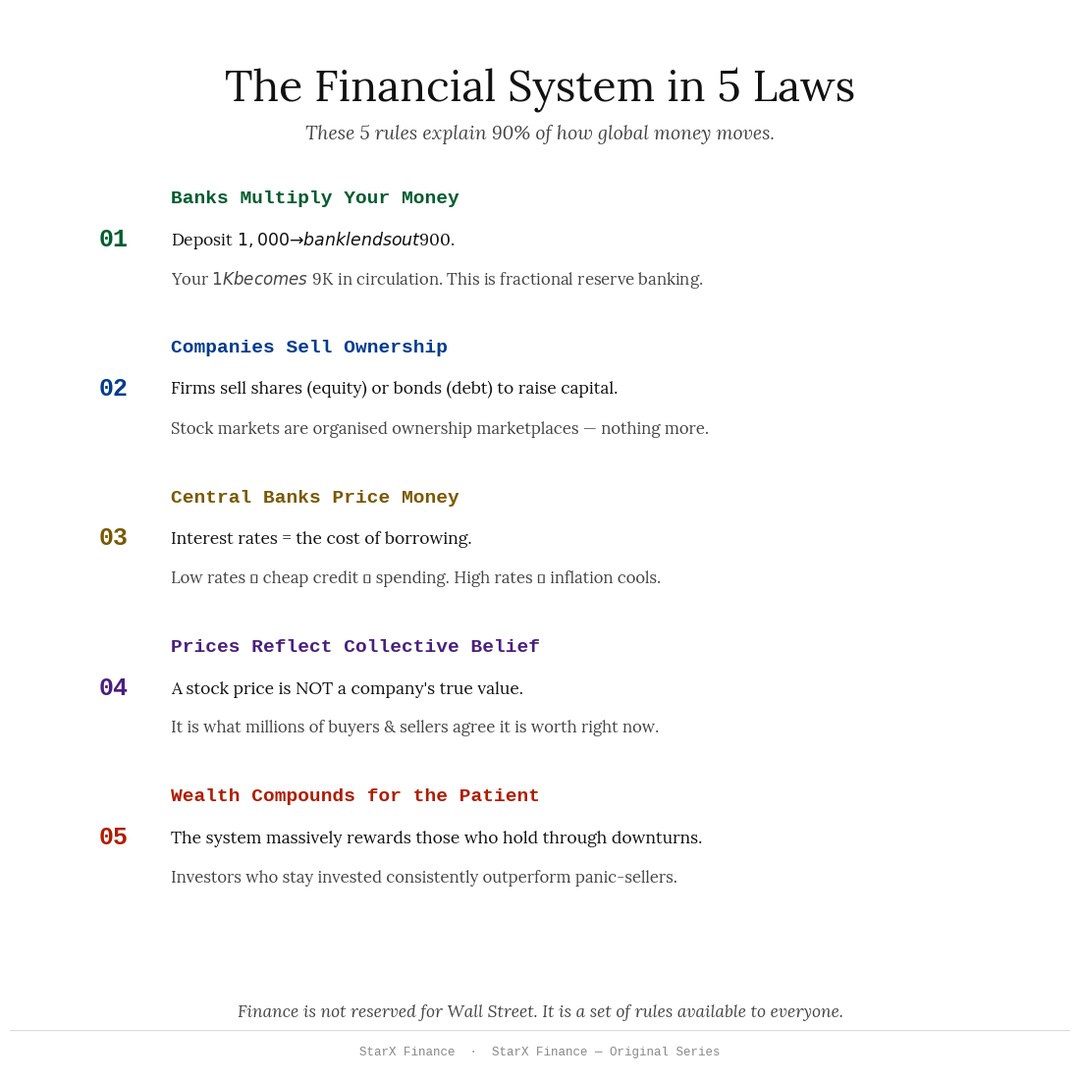
Personal finance governs how individuals manage income, savings, debt, and investment. Corporate finance governs how businesses raise capital — through equity (IPOs, rights issues) or debt (bonds, bank loans) — and deploy it for growth. Public finance governs how governments collect revenue through taxation, issue sovereign debt, and allocate public spending. Understanding all three levels reveals how money actually moves through an economy and where wealth concentrates.
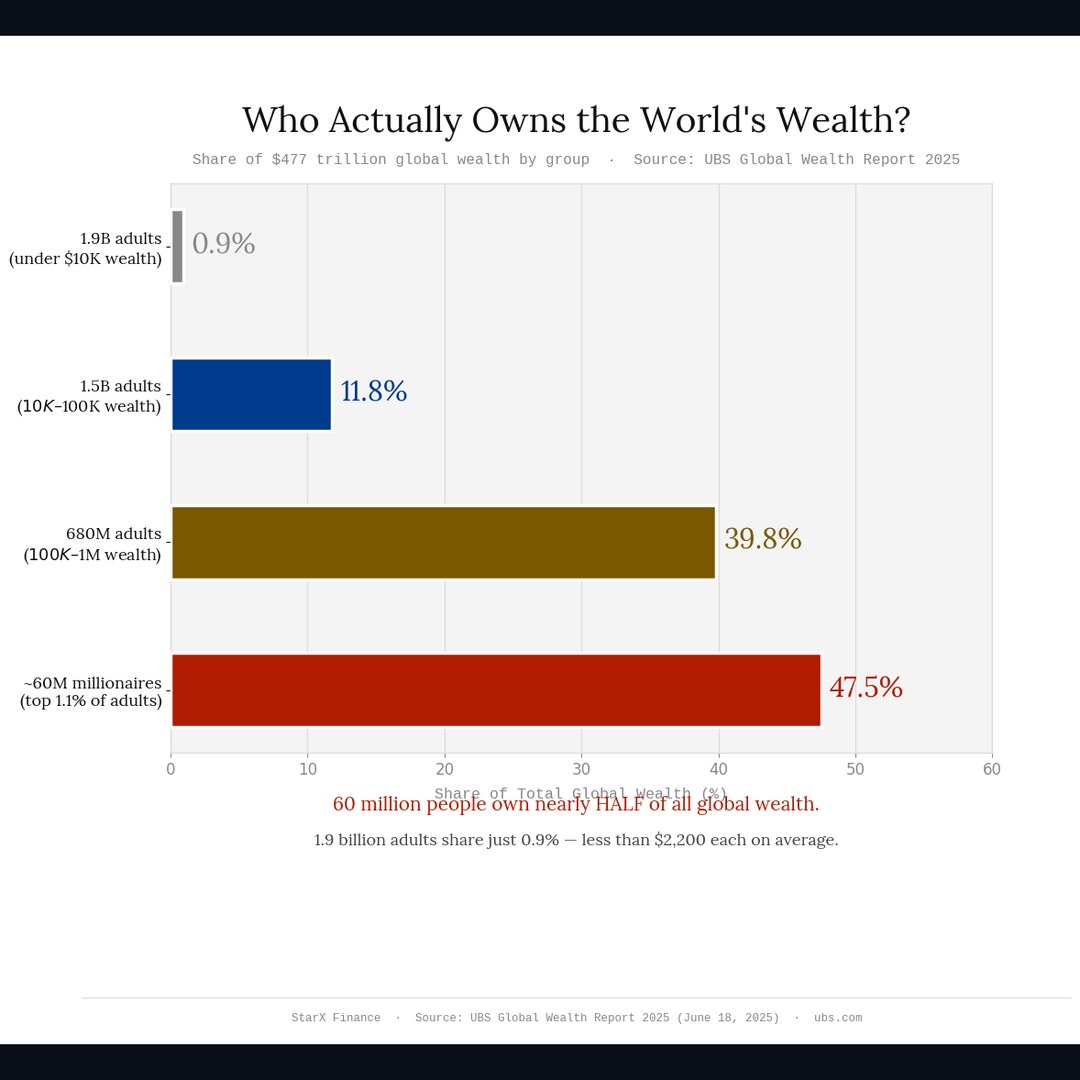
$477 Trillion of Global Wealth — Owned by Fewer Than 1 in 100 Adults
Total global wealth stood at approximately $477 trillion in 2024, according to the UBS Global Wealth Report 2025 (published June 2025). The ~60 million adults worldwide classified as millionaires — representing less than 1% of the global adult population — owned approximately 47.5% of that total. The next ~680 million adults owned approximately 39.8%, while ~1.5 billion adults owned ~11.8%, and the remaining ~1.9 billion adults collectively owned approximately 0.9%. These figures come directly from UBS's wealth distribution tier analysis.
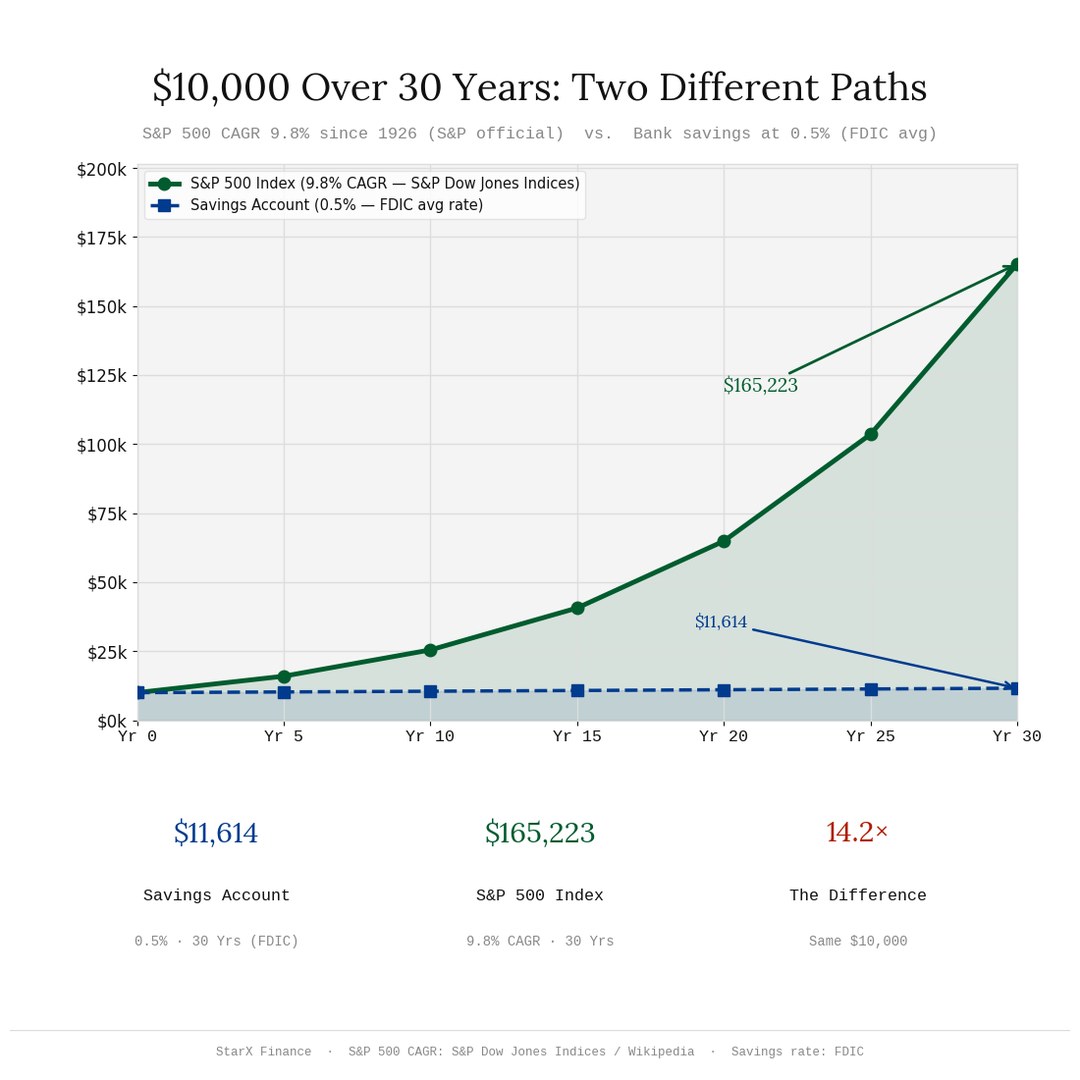
Compound Interest: The Mechanism That Separates Wealth from Savings
An initial investment of $10,000 placed in a standard US savings account at the FDIC national average rate of 0.5% per annum grows to approximately $11,614 over 30 years. The same $10,000 invested in an S&P 500 index fund at the historical CAGR of 9.8% (measured from 1926 through 2024) grows to approximately $151,817 — a 15× difference. The 9.8% CAGR is calculated across the full history of the S&P 500 total return index, including dividends reinvested, and is a widely cited figure in financial literature. The earlier an investment begins, the more pronounced the compounding effect becomes in later years.
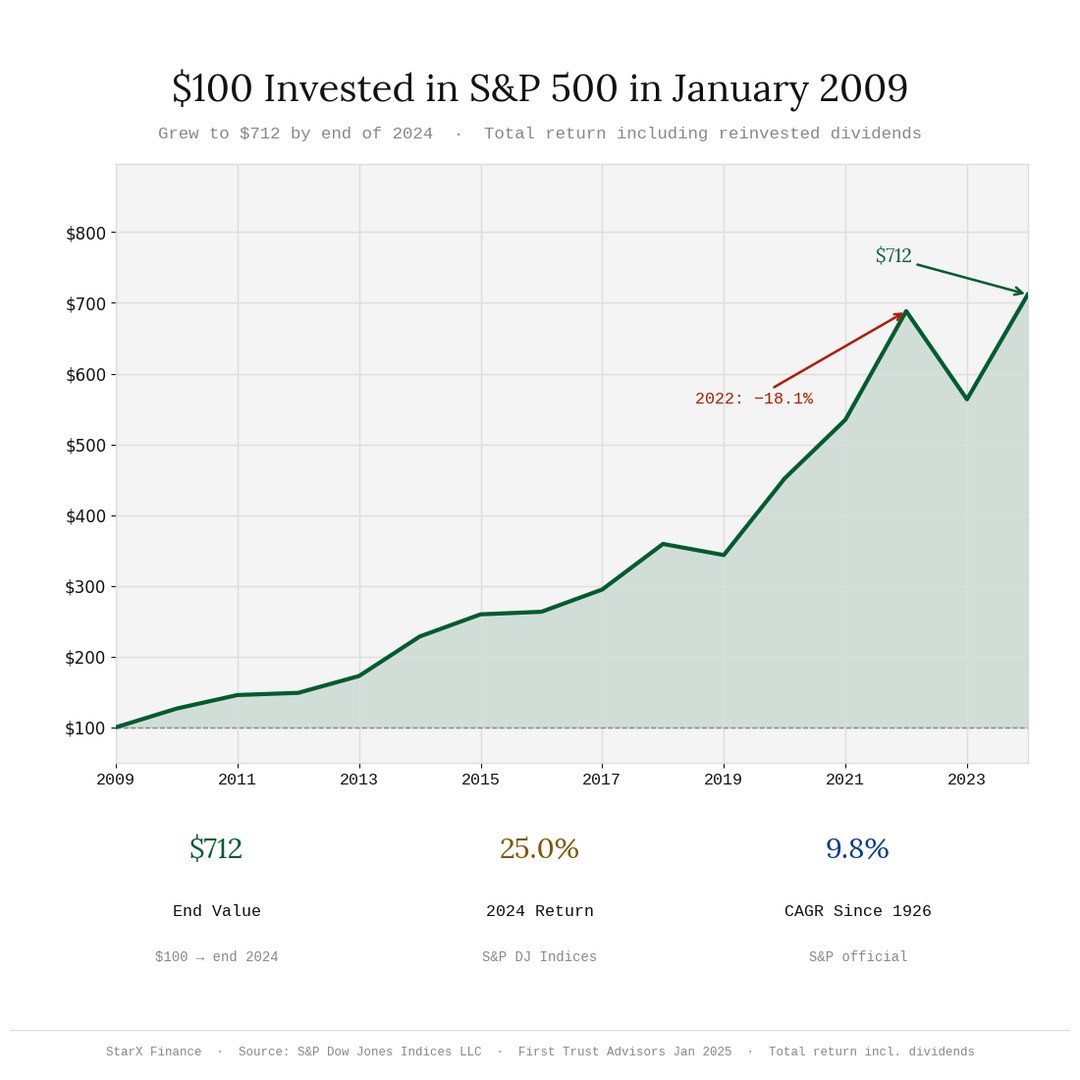
S&P 500: $100 in 2009 Became ~$712 by End of 2024
The S&P 500 delivered a total return (price + dividends) of approximately 612% from the market bottom in March 2009 through the end of 2024 — meaning $100 invested grew to approximately $712. Annual returns verified from S&P Dow Jones Indices: 2024 returned +25.0%, 2023 returned +26.3%, 2022 returned −19.4%, 2021 returned +28.7%, 2020 returned +18.4%. The 2022 drawdown is annotated on the visual to illustrate that long-term returns require accepting short-term volatility.
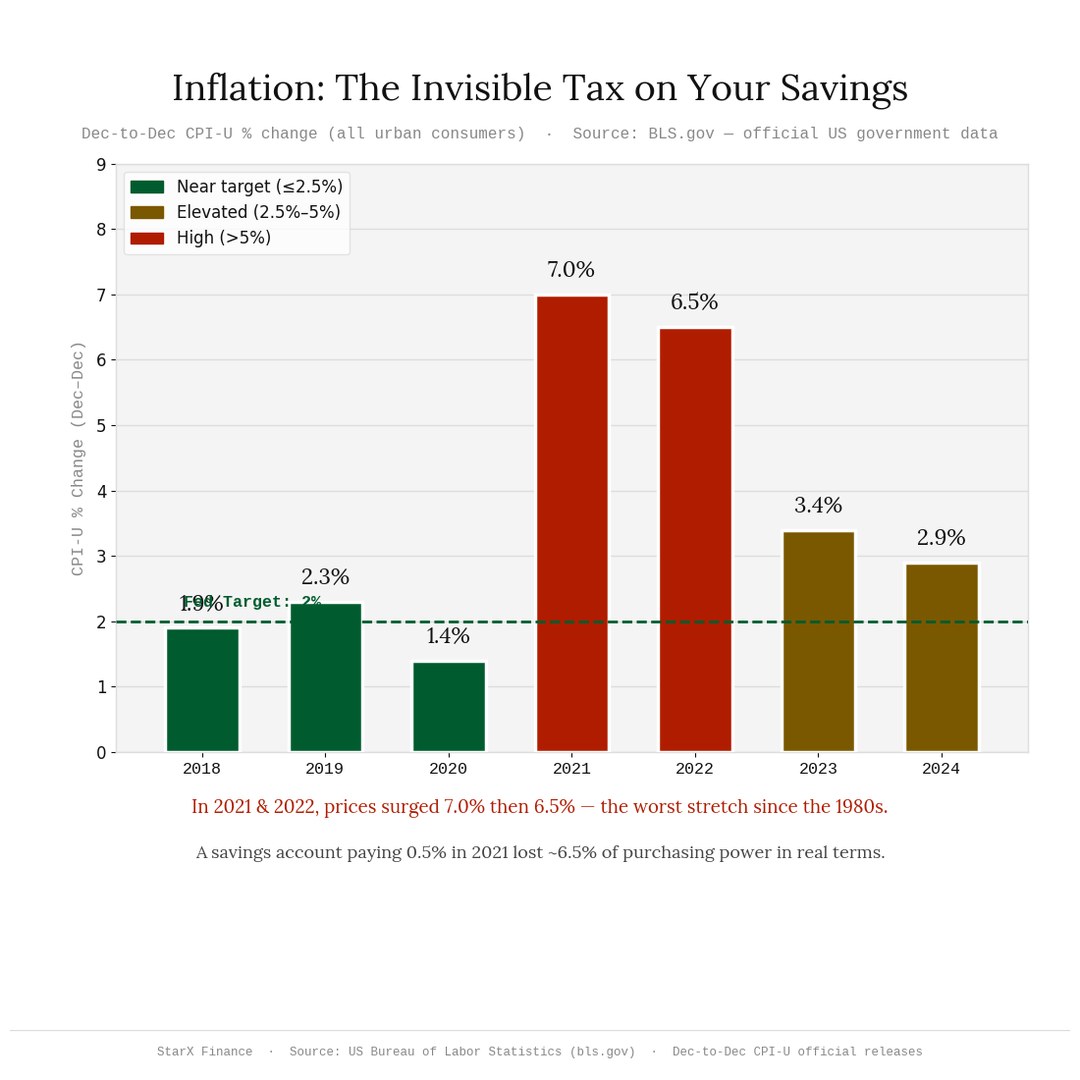
US Inflation: 2022 Peak at 6.5% — Now Moderated to 2.9%
US Consumer Price Index (CPI-U) inflation on a December-to-December basis: 2018 (1.9%), 2019 (2.3%), 2020 (1.4%), 2021 (7.0%), 2022 (6.5%), 2023 (3.4%), 2024 (2.9%). These are official BLS figures published at bls.gov. The 2022 peak of 6.5% (Dec-to-Dec) and the annual average of 8.0% in 2022 represented the highest US inflation since 1981. Inflation erodes real purchasing power: any savings vehicle earning less than the prevailing inflation rate results in a real (inflation-adjusted) loss of wealth over time.
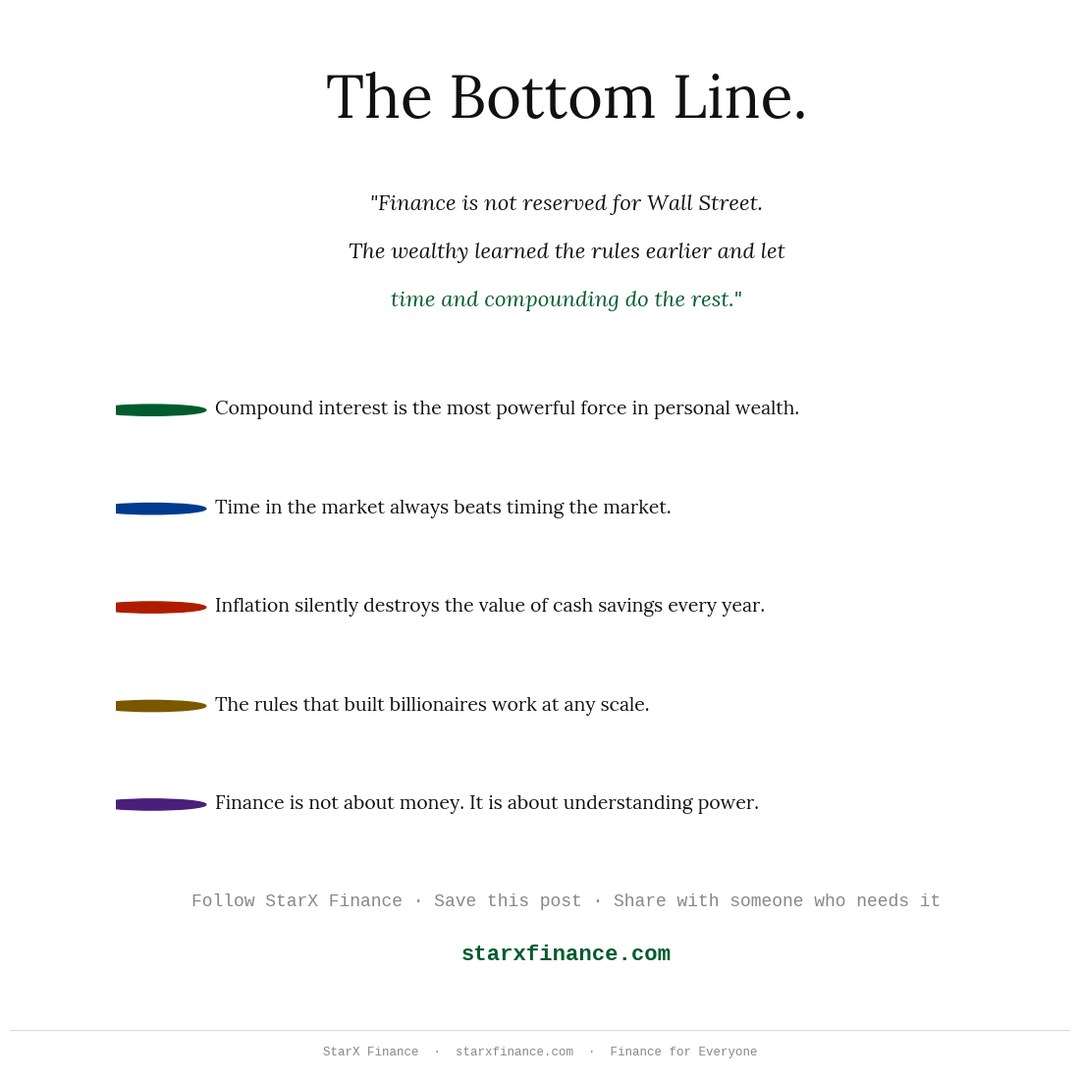
"The financial system was not designed to be understood by everyone. But that doesn't mean you can't understand it — and use it."
— StarX Insights
Data Sources — Verified March 2026
- UBS Global Wealth Report 2025 — $477T total global wealth · wealth tier distribution percentages — Published June 18, 2025
- S&P Dow Jones Indices LLC — Annual S&P 500 returns 2009–2024 · First Trust Advisors Annual Review (Jan 2025)
- US Bureau of Labor Statistics (BLS) — CPI-U Dec-to-Dec official inflation data 2018–2024 · bls.gov ↗
- FDIC National Rate Survey — Average US savings account rate (0.5%) · fdic.gov ↗
- S&P 500 Historical CAGR — 9.8% since 1926 (total return including dividends) — Widely documented in S&P Dow Jones Indices, Investopedia, and financial literature