All statistics in this report have been cross-verified against primary institutional sources. Where figures have been updated since original publication, the latest available data is shown. No estimates or projections are presented as factual data.
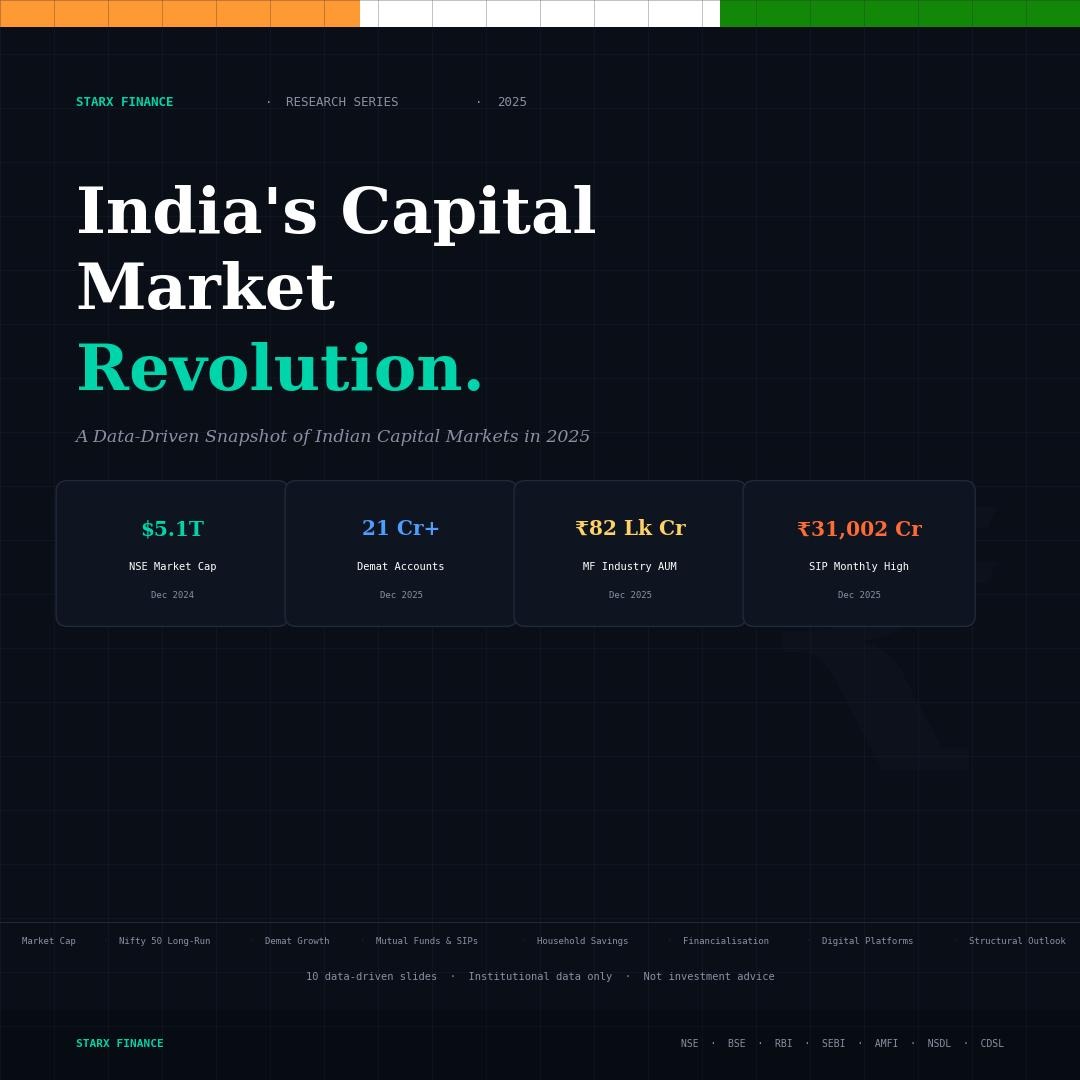
India's capital markets are undergoing a generational transformation. The country's equity market capitalisation stands at $5.09 trillion as of February 2026, placing India consistently among the world's five largest exchanges. This report presents a structured, data-first analysis of that transformation across 10 key dimensions.
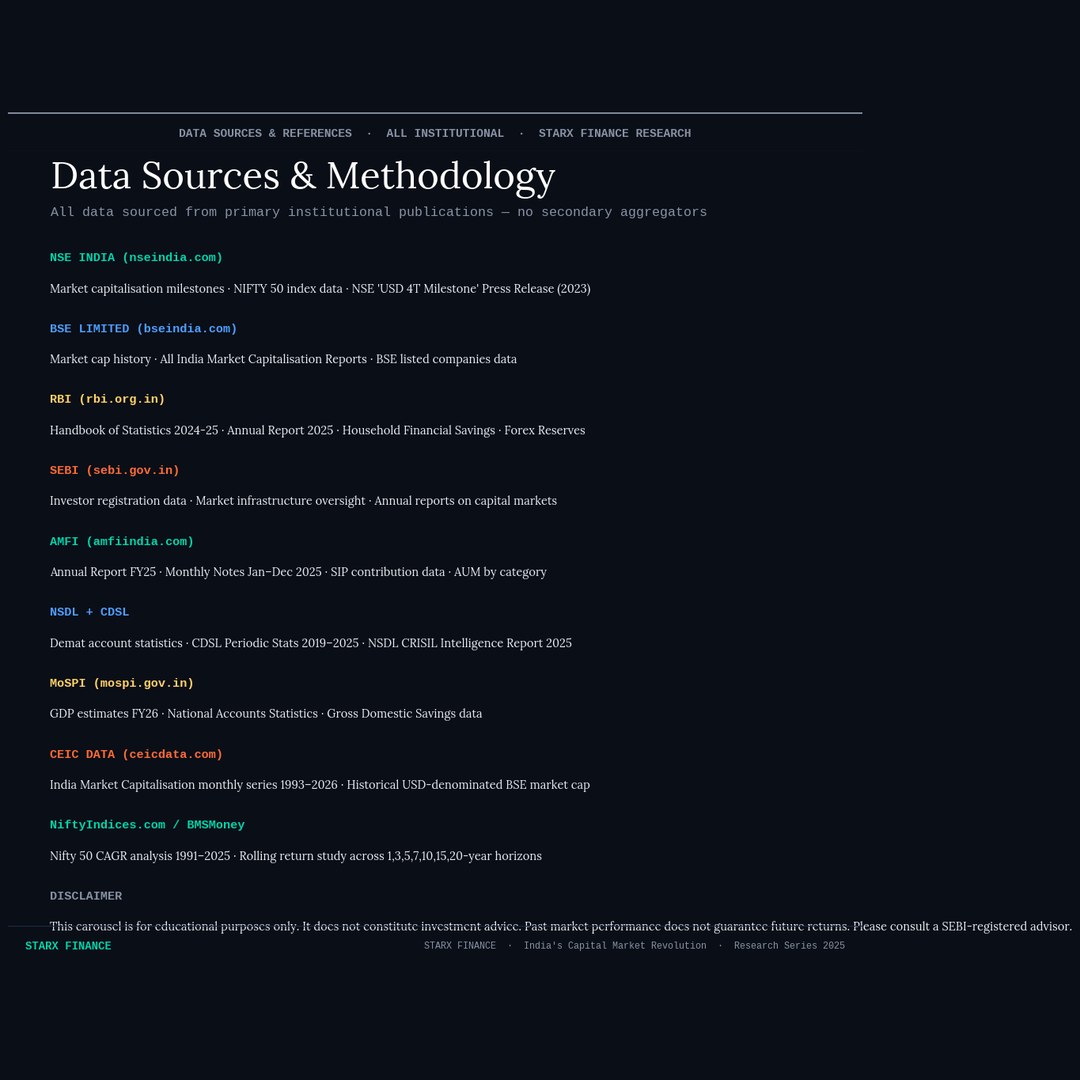
All data sourced exclusively from primary institutional publications: NSE, BSE, RBI, SEBI, AMFI, NSDL, CDSL, and MoSPI. Each claim is attributed to its source. No secondary aggregators. No estimates presented as facts.
Research Carousel — 10 Slides
Tap arrows or swipe to navigate. Each slide backed by institutional data.
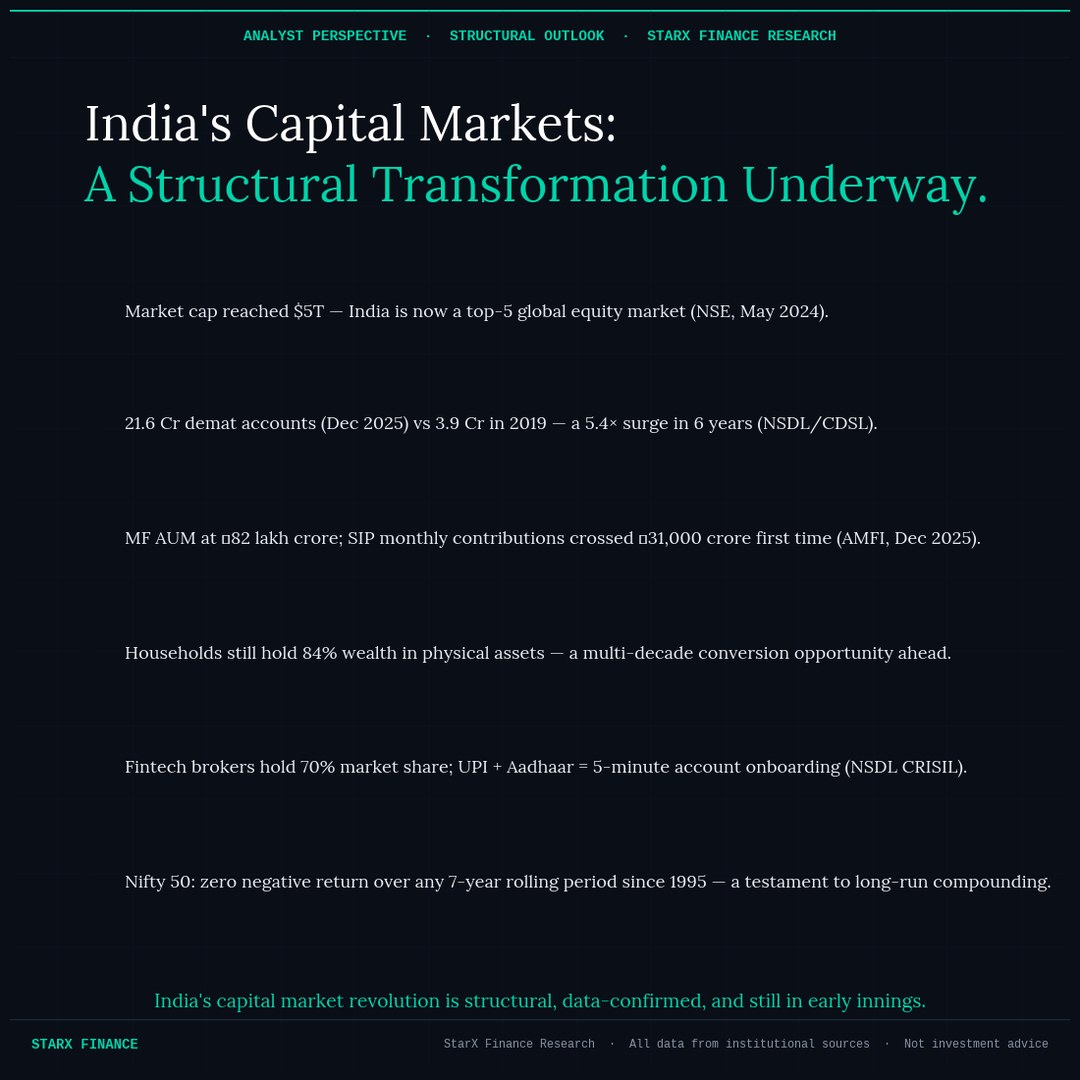
Key Findings
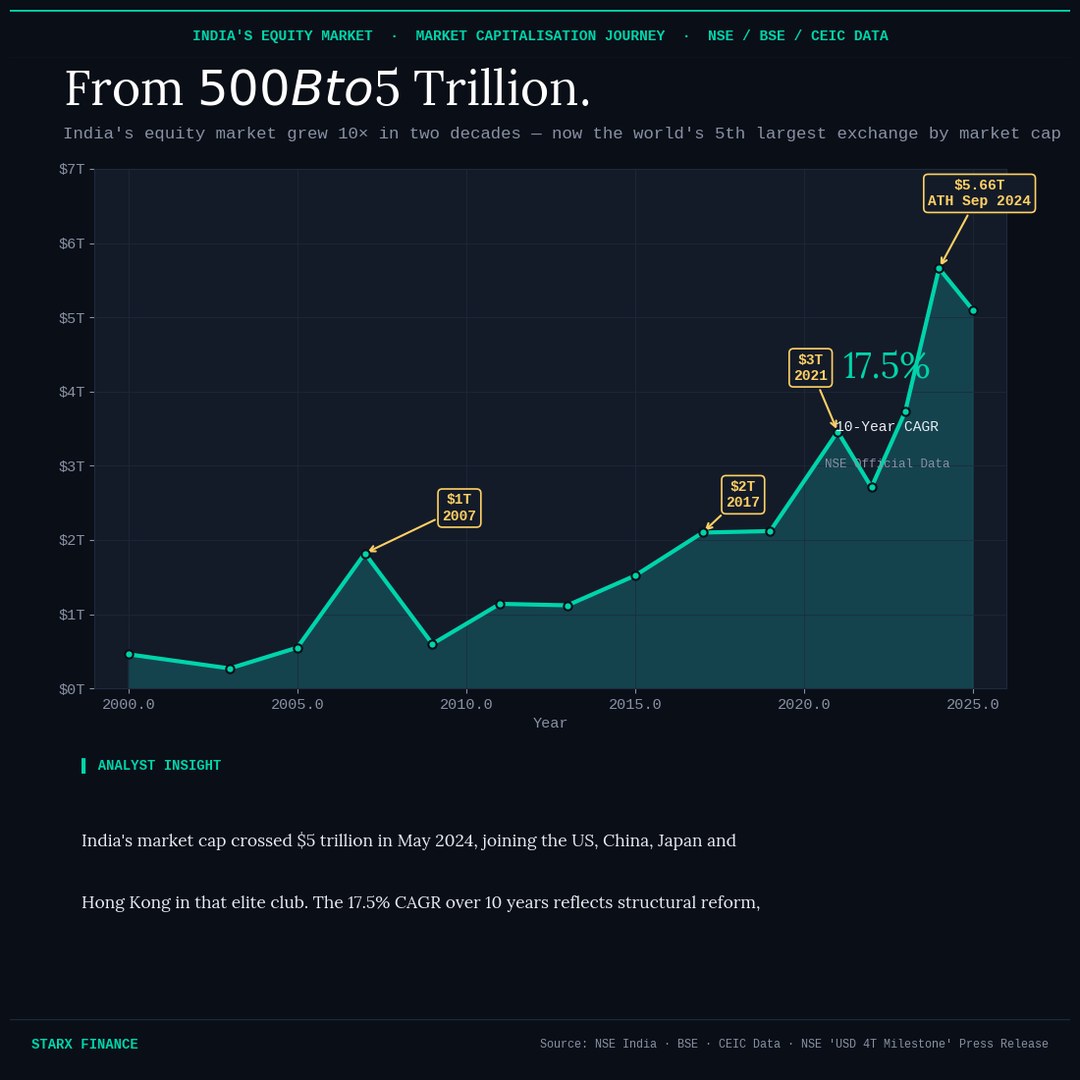
India Crossed $5 Trillion in Market Cap — Now the World's 5th Largest Exchange
India's NSE crossed $5 trillion in market capitalisation on May 23, 2024 — confirmed by NSE's official press release of that date. The all-time high stood at $5.66 trillion in September 2024 (CEIC/BSE data). As of February 2026, the market cap stands at $5.09 trillion. Over 10 years, the market has delivered approximately 17.5% CAGR, placing India among the fastest-growing major equity markets globally.
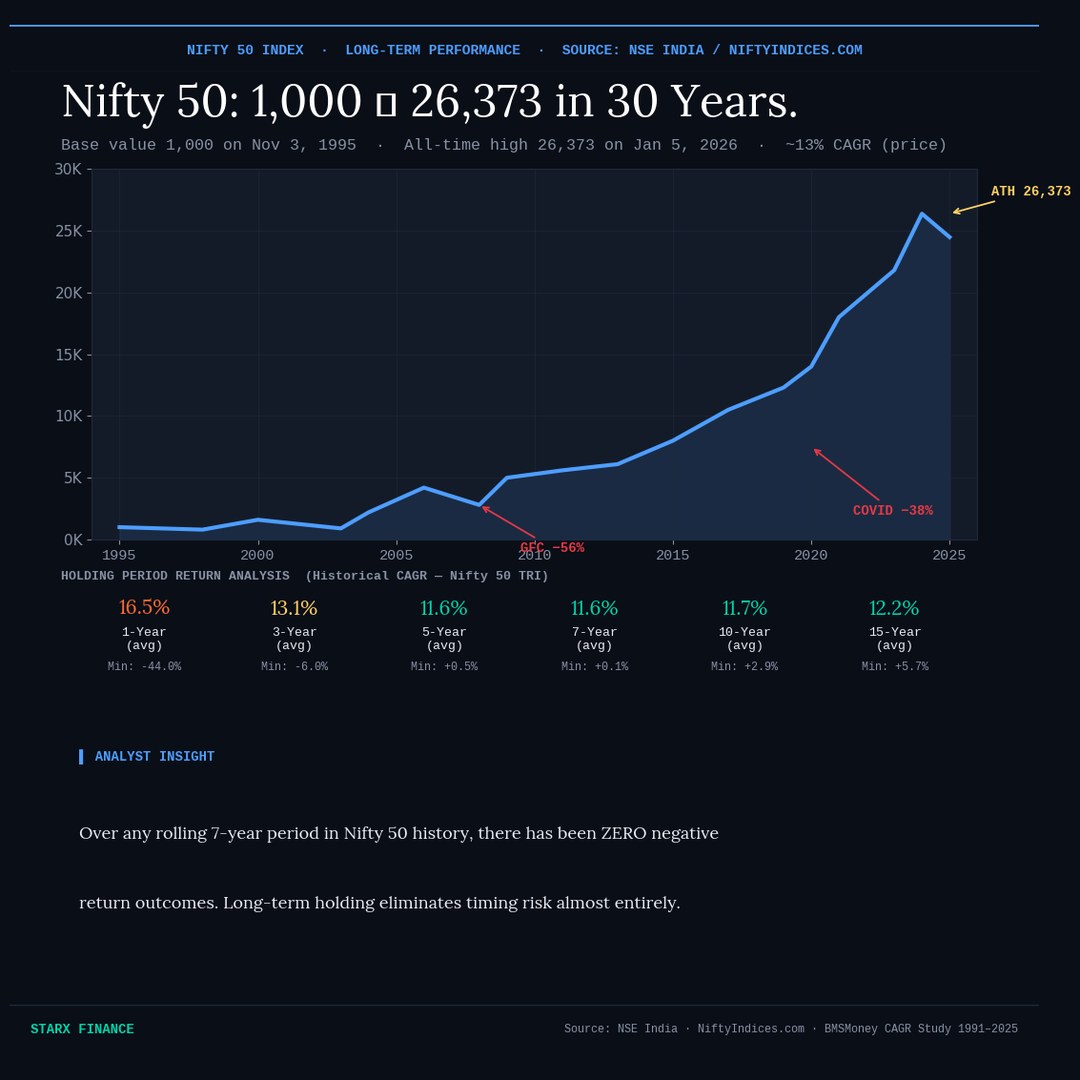
Nifty 50: From Base 1,000 to All-Time High 26,373 — Zero Negative 7-Year Returns
The Nifty 50 was launched with a base value of 1,000 on November 3, 1995. It touched an all-time high of 26,373 on January 5, 2026. The index has delivered approximately 13% CAGR on a price basis since inception. Historical rolling-period analysis shows no negative return for any 7-year or longer holding period in the index's 30-year history — meaning investors who stayed invested for 7+ years have never lost money on the index.
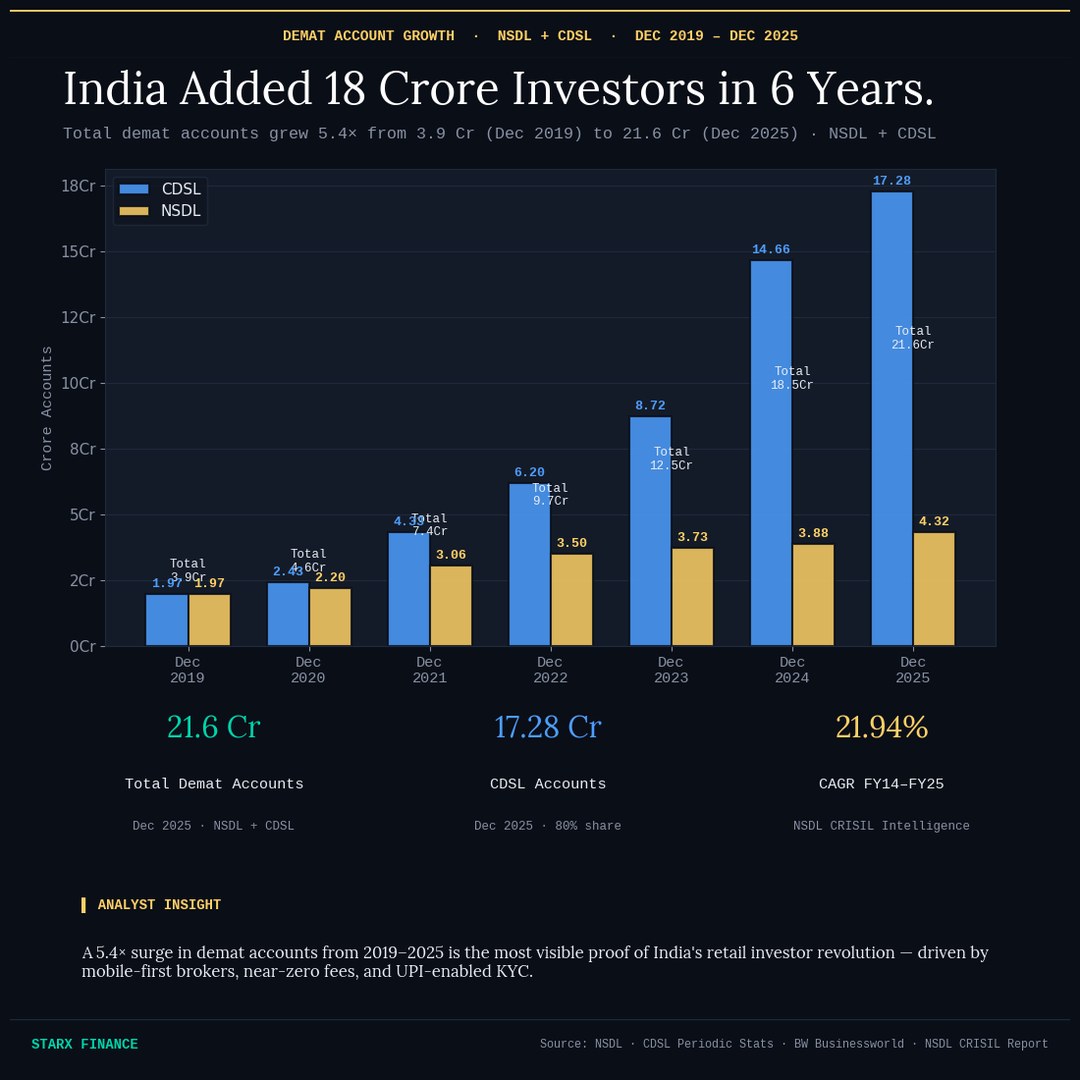
Demat Accounts: 21.6 Crore as of December 2025 — 5.4× Growth Since 2019
Total demat accounts reached 21.6 crore by December 2025, comprising 17.3 crore at CDSL and 4.3 crore at NSDL — confirmed by SEBI's monthly update and Business Standard (January 23, 2026). This is a 5.4× increase from 3.94 crore in December 2019. CDSL added 2.62 crore accounts in calendar year 2025, a 17.9% increase, while NSDL added 0.44 crore (11.4% growth). Growth rate moderated to 16.5% in 2025 from 33% in 2024, reflecting post-pandemic normalisation.
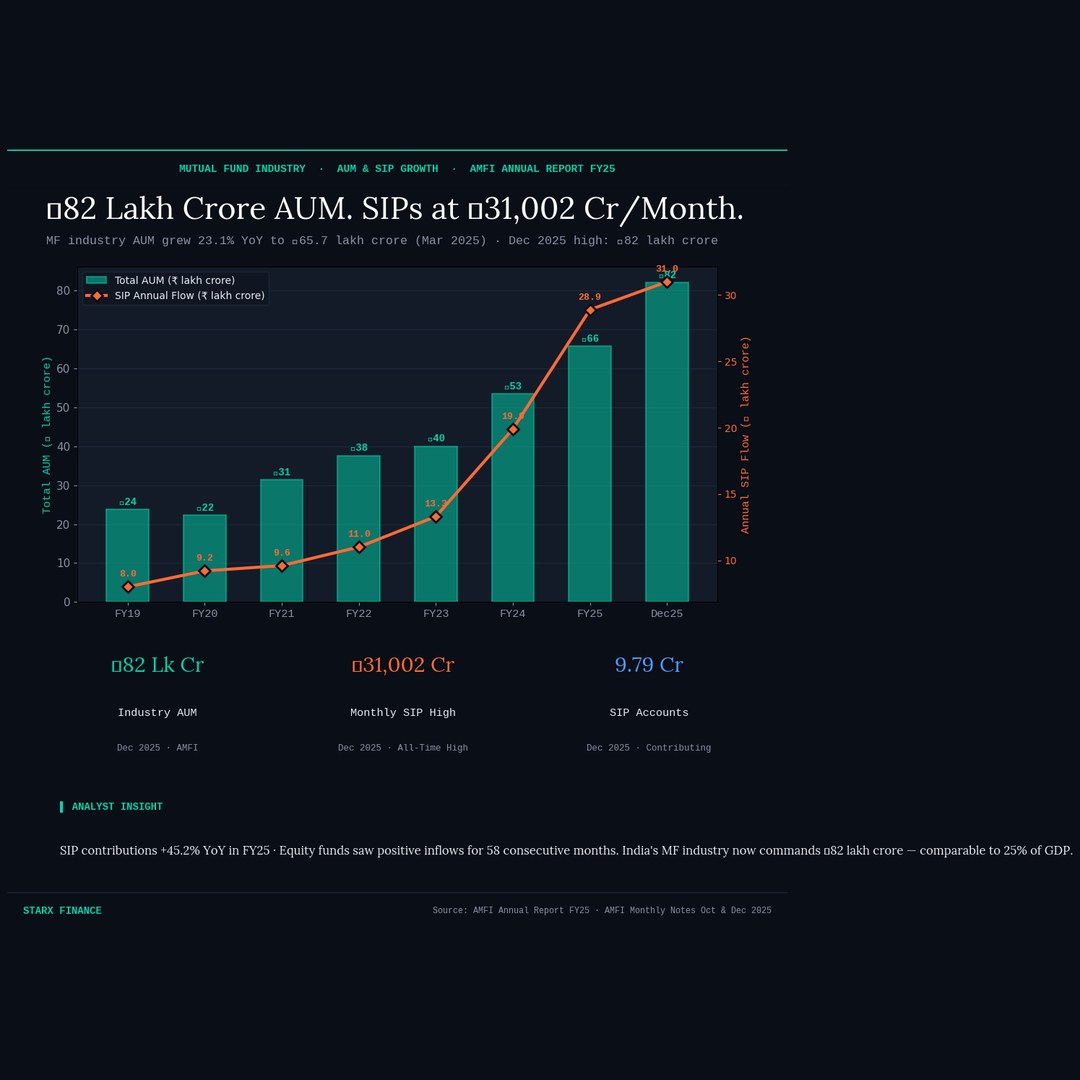
MF Industry: ₹81.01 Lakh Crore AUM · SIP at ₹31,002 Crore/Month
India's mutual fund industry AUM stood at ₹81,01,305.58 crore (₹81.01 lakh crore) as of January 31, 2026, up from ₹80.23 lakh crore in December 2025 — per AMFI's official monthly data released February 10, 2026. The industry average AUM for January 2026 was ₹82,01,174.62 crore. Monthly SIP contributions stood at ₹31,002.33 crore in January 2026, with 9.92 crore contributing SIP accounts. Equity funds have recorded positive inflows for 59 consecutive months since March 2021. Total MF folios reached 26.63 crore in January 2026.
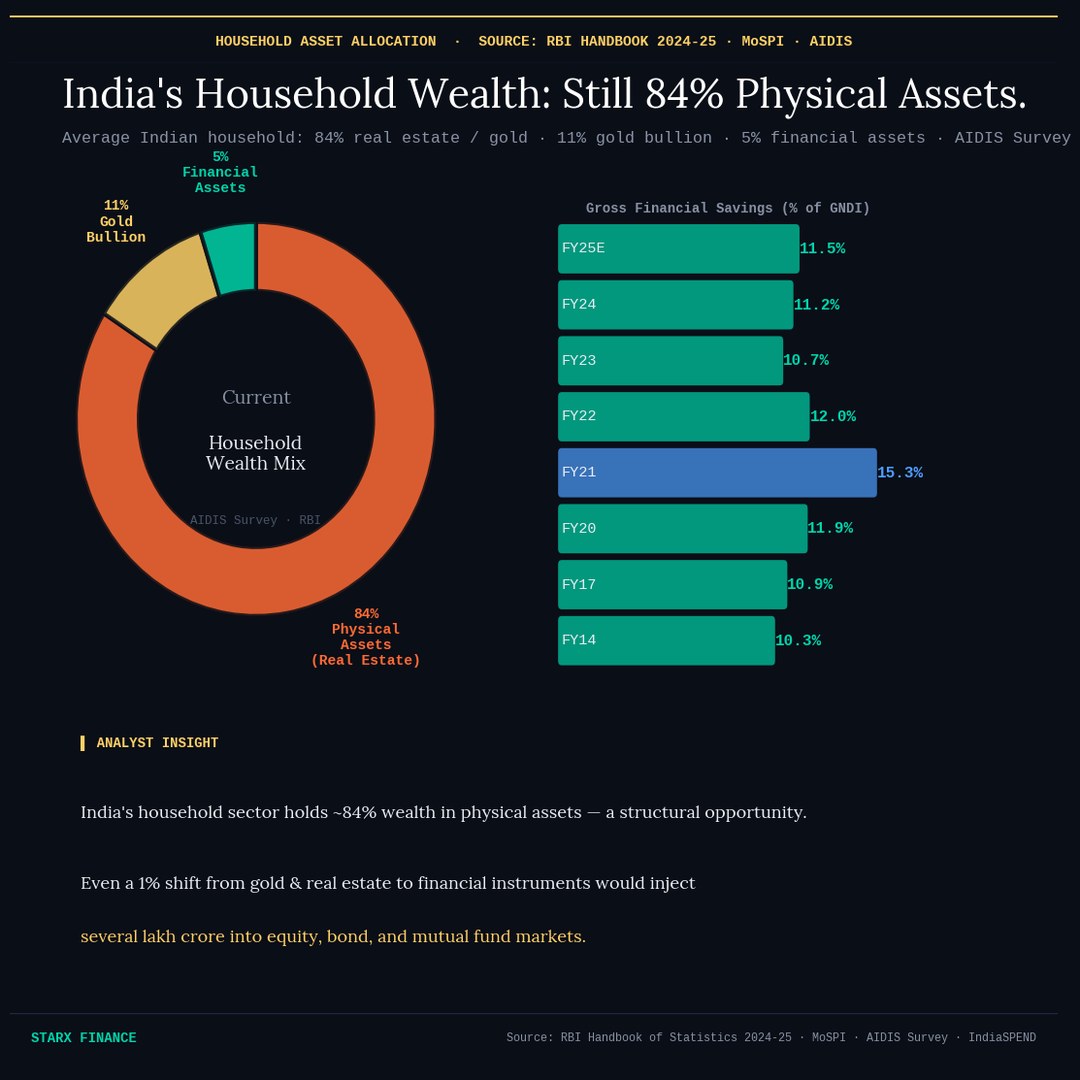
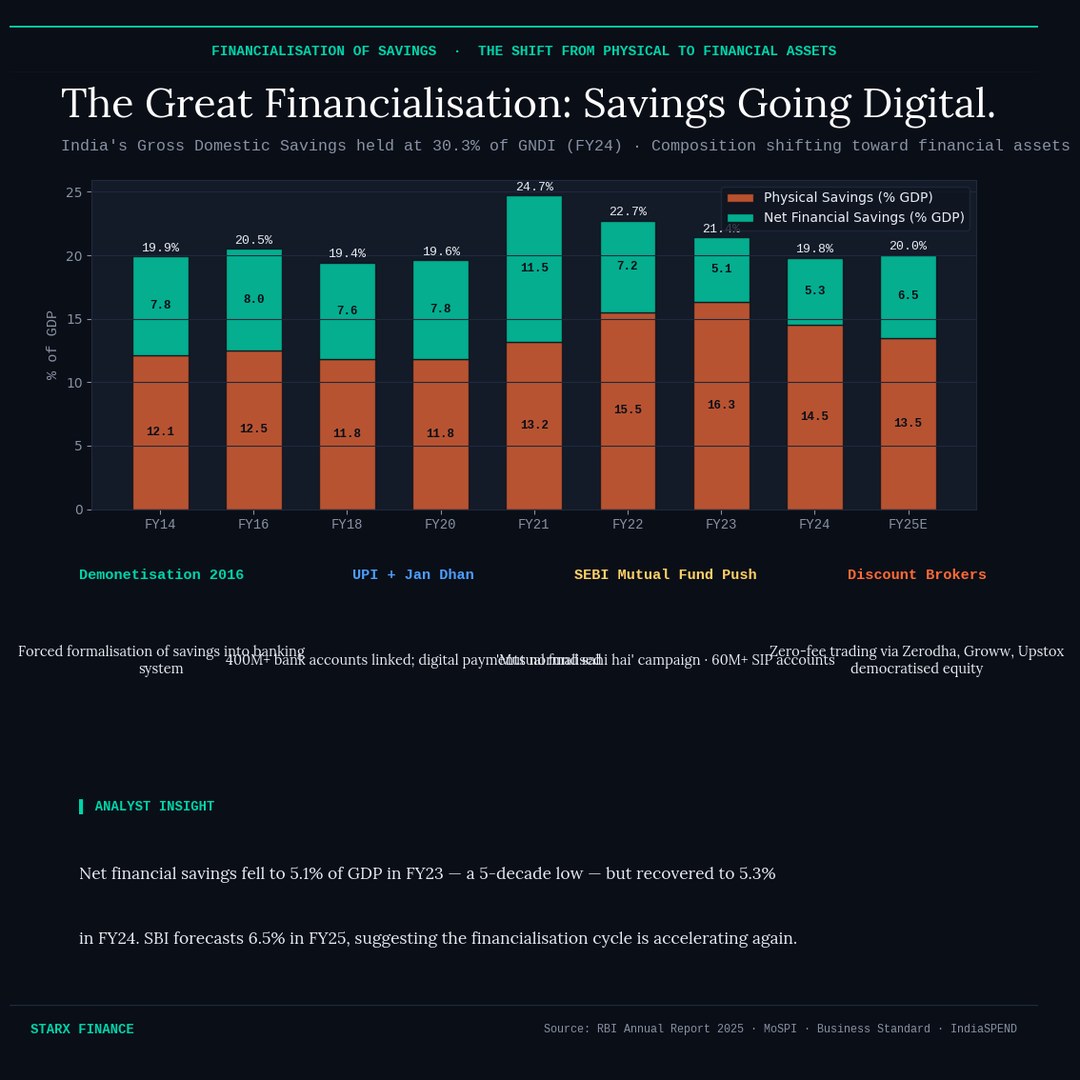
84% of Household Wealth Still in Physical Assets — The Structural Opportunity
Despite rapid financialisation, Indian households hold approximately 84% of wealth in physical assets — primarily real estate and gold — per the All India Debt and Investment Survey (AIDIS) and RBI Handbook of Statistics 2024-25. Financial assets account for approximately 5% of household wealth. India's gross domestic savings rate remained at ~30.3% of GNDI (FY24), while net financial savings recovered to an estimated 5.3% in FY24 from a 5-decade low of 5.1% in FY23 (RBI Annual Report 2025).
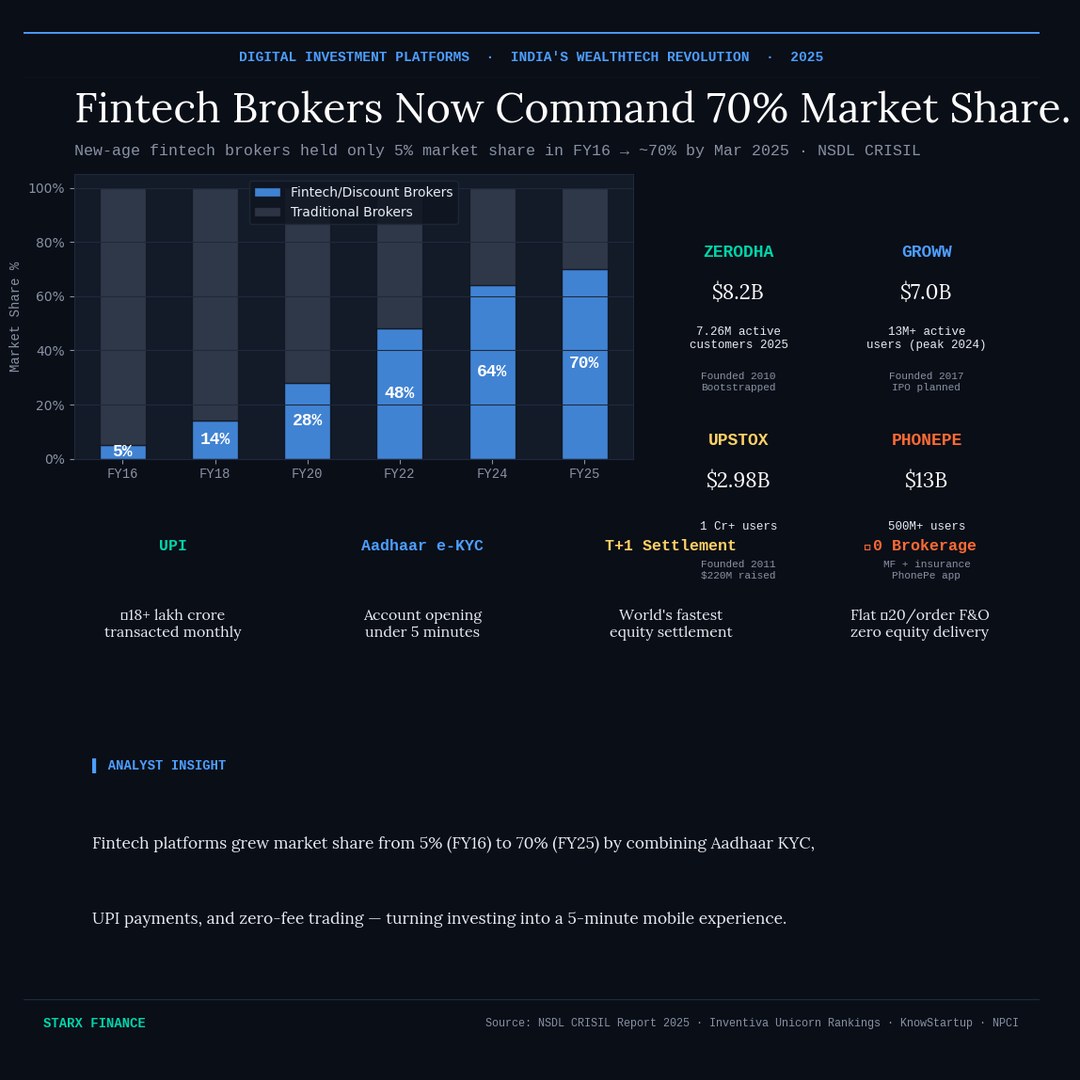
Fintech Brokers: 5% Market Share (FY16) → ~70% (FY25)
New-age fintech and discount brokers held approximately 5% of India's brokerage market in FY16. By March 2025, that share had grown to approximately 70%, per the NSDL CRISIL Intelligence Report 2025. Platforms like Zerodha (7.26M active users), Groww (13M+ peak users), and Upstox (1 crore+ users) democratised investing through Aadhaar-enabled KYC, UPI payment rails, flat ₹20/order F&O pricing, and zero-cost equity delivery — reducing the barrier to investing to under 5 minutes on a mobile phone.
"India's capital market revolution is structural, data-confirmed, and still in early innings. The 84% physical asset allocation of Indian households represents the single largest long-term conversion opportunity in any emerging market."
— Sarthak Shridhar Pande — StarX Insights, March 2026
Primary Data Sources — Verified March 2026
- NSE India — Market cap milestones · NSE '$5T Milestone' Press Release (May 23, 2024) · nseindia.com ↗
- BSE Limited / CEIC Data — Historical USD market cap series · ATH $5.66T (Sep 2024) · Current $5.09T (Feb 2026)
- AMFI (amfiindia.com) — Monthly data Feb 10, 2026: AUM ₹81.01 lakh crore, SIP ₹31,002.33 crore, 26.63 crore folios · amfiindia.com ↗
- NSDL + CDSL — Demat: 21.6 crore (Dec 2025) = 17.3 Cr CDSL + 4.3 Cr NSDL · SEBI Monthly Update · Business Standard Jan 23, 2026
- RBI — Handbook of Statistics 2024-25 · Annual Report 2025 · MPC Statements · rbi.org.in ↗
- SEBI — Monthly market updates · Capital market annual reports · sebi.gov.in ↗
- MoSPI — GDP estimates FY26 · National Accounts Statistics · mospi.gov.in ↗
- NSDL CRISIL Intelligence Report 2025 — Fintech market share data (5% FY16 → 70% FY25)
- NiftyIndices.com / BMSMoney — Nifty 50 rolling return analysis (1991–2025)
- RBI AIDIS / MoSPI — Household asset allocation (84% physical assets)